At-Home Paper Chromatography Experiment Of Food Dyes
At-HomeChemistryExperimentPaper Chromatographyof Food Dyes and InkObjectivesTo identify the food drug and cosmetic (FD&C) dyes found in food/beverage samples (such asKool-aid, Gatorade, popsicles), or water-soluble markers, using the paper chromatographytechnique. Determination of the retention factor (Rf) values of the dyes found in the samples andcomparison with those of known commercial sources will be carried out in this at-homeexperiment.IntroductionChromatography is a widely used technique in both chemistry and biology, to separate andidentify molecules within a mixture of unknown substances. The process of chromatographyemploys the use of two different phases; the mobile phase (which is moving), and the stationaryphase (which is not moving). The different components of the mixture will be carried by the mobilephase through the stationary phase, with the components having varying affinities for the twophases. The compounds with a higher affinity towards the stationary phase will travel the shortestdistance, while those with a weaker affinity towards the stationary phase will travel the furthest.This development process allows for the separation or resolution of the various components of amixture. If the resolution is sufficient, it allows for the identification of the unknown componentsbased on the resolution of standard, known compounds.The process of chromatography is widely used and applied in various techniques in organicchemistry, analytical chemistry and biochemistry. Such applications include paperchromatography, thin layer chromatography (TLC), high performance liquid chromatography(HPLC), and gas chromatography (GC), as well as many other more recent variations of thesetechniques.In this experiment, paper chromatography will be used to separate and identify dyes present invarious food or ink products. Chromatography paper is made of cellulose molecules which containpolar water molecules trapped between the fibers serving as the stationary phase. The polar andionic 0.1 % salt-water solution will serve as the mobile phase. The dye/ink samples are spottedonto the porous chromatography paper and the salt-water will travel up the paper by surfacecapillary action. As the dissolved dye/ink pigments migrate up the paper, they will spend sometime interacting with the mobile and stationary phases. The samples which spend more timeinteracting with the water in the cellulose fibers will migrate less, while those interacting more withthe solvent will migrate further up the chromatography paper.The distance that a compound travels on the chromatogram is expressed as the retention factor,or Rf value, which is the ratio of the distances travelled from the starting line to the compoundand to the solvent front (Equation 1 and Figure 1a). The Rf of a compound is a characteristic valuethat cannot be theoretically obtained. It must be determined experimentally and is dependent onthe conditions used for the chromatography.1
𝑅𝑓 𝑑𝑖𝑠𝑡𝑎𝑛𝑐𝑒 𝑡𝑟𝑎𝑣𝑒𝑙𝑙𝑒𝑑 𝑏𝑦 ��𝑛𝑐𝑒 𝑡𝑟𝑎𝑣𝑒𝑙𝑙𝑒𝑑 𝑏𝑦 𝑠𝑜𝑙𝑣𝑒𝑛𝑡 𝑓𝑟𝑜𝑛𝑡(1)Figure 1: a) Calculation of the Rf value, b) Developed chromatogram – lanes: (1) sample 1, (2) Co-Spot, (3) sample 2Small changes in the solvent, temperature, amount of sample applied, presence of othercompounds, and the coating thickness (when using adsorbents), can affect the Rf value. Inpractice, it is usually not possible to control all of these conditions completely. For this reason,when using paper chromatography to investigate two samples suspected of being the samecompound, a comparison should always be carried out by spotting (applying) both samples onthe same paper. For example, in Figure 1b, a mixture of dyes from a food sample was spotted inlane 1 (on the left). It shows the presence of two components with Rf values of 0.38 and 0.16. Acomparison with the compound in lane 3 (on the right) shows that it may be the same compoundas the top spot in lane 1 (Rf value of 0.38). Because elution of the spots isn't always perfect (thesolvent front may not always run in a straight line), it can be difficult to differentiate between R fvalues that are in separate lanes, especially if the values are close. Thus, having a lane (2) whereyou spot samples used for lane 1 and lane 3 can serve as a "reference". This is referred to as a‘co-spot’ and will allow you to see where all the spots elute when they are in the same lane. InFigure 1b, it is evident that the top spot in lane 1 is the not the same compound as the one in lane3.When spotting a sample on the chromatography paper, it is important that the spot is small(approximately 2-3 mm in diameter) and not too concentrated. This will allow for better separationand resolution of the components in a mixture. If spots are large or too concentrated, the spotson the chromatogram may overlap, or show ‘tailing’ (Figure 3), which is a spot that has a tail thatextends towards the origin. Changing the composition of the mobile phase so that it is a mixtureof polar and non-polar substances, can help to improve separation and resolution of the spots.Figure 2: Tailing effect of samples - lanes: (1) well resolved spot, (2) spot with tailing,(3) determining the center of migration for a spot with tailing.2
The FDA (Food and Drug Administration) is responsible for the approval of food dyes that can beused for consumption in the United States, while Health Canada is responsible for those used inCanada. There are currently 9 approved dyes in Canada for use in food products. These are red2, red 3, red 4, red 40, blue 1, blue 2, yellow 5, yellow 6, and green 3. Reds 2 and 4 are notapproved by the FDA in the U.S. Red 4 (Ponceau red) is not often used in Canada and has beenomitted from the Table 1 and Figure 3 below. All of these food dyes are relatively large compoundsthat contain a conjugated ring system with alternating single and double carbon-carbon bonds.In this at-home experiment, the dyes in various food or ink samples will be identified usingcommercial food dyes as the known, standard compounds.Name of DyeAllura RedFD&C #Red 40European #E129AmaranthRed 2E123ErythrosineRed 3E127IndigotineBlue 2E132Sunset Yellow FCFYellow 6E110TartrazineYellow 5E102Fast Green FCFGreen 3E143ColourBrilliant Blue FCFBlue 1E133Table 1: FD&C approved food dyes for use in Canada.Figure 3: Structures of 8 commonly found FD&C food dyes in Canada.3
Materials 1 Sheet of Whatman # 1chromatography paper 20 x 25 cmScissorsPencilRulerToothpicks*Clear plastic wrap (Saran-Wrap)Clear container (at least 12 cm inheight), or a tall, colourless drinkingglass SaltWaterCommercial food colouring, “ClubHouse” brand (regular or Neon) **3 Samples of food/items withartificial food colouring using avariety of colours**** see troubleshooting suggestions if no toothpicks are available.** see troubleshooting suggestions if using a different brand.*** possible examples include: Kool-aid, Gatorade, coloured candy coating (Skittles) orpopsicles with artificial food colouring, or water-soluble markers. See instructor if trying adifferent sample.ProcedurePart A - Preparation of the Stationary Phase and the SamplesFigure 4: Whatman #1 chromatography paper with divisions for spotting1. Cut the sheet of Whatman chromatography paper into 4 sheets (height: 10 cm by width:12.5 cm).2. Using a pencil, for each sheet, draw an origin line that is 2 cm from the paper’s edge(along the width). See Figure 4 andFigure 5.4
3. Beginning 1.75 cm from the left, place small marks on the origin line every 1.5 cm.4. Label the marks on the origin line with your choice of 3 unknown samples, and the 4commercial food colours (which will be used as the standards).Figure 5: Diagram for the chromatogram5. The liquid food/item may be used as is. A solid sample must be dissolved in theminimum amount of water.6. Place ONE drop of each of the 4 commercial food colours onto a plate (or Ziploc bag orwax paper, see Figure 6a).7. Slowly dip the thinnest end of a wooden toothpick into one of the commercial food coloursolutions (standards) and then spot the paper on the corresponding mark. Be sure tokeep the toothpick vertical and touch the paper for only an instant to keep the diameterof the spot to 2-3 mm. Allow the spot to dry (blow on the spot to help dry it quicker). Becareful not to puncture the paper.8. Repeat step 7 twice, applying the same sample on the corresponding location to makethe spot on the paper more concentrated. It is important to allow the spot to dry aftereach application to prevent the spot from getting too big in diameter.9. Using a separate wooden toothpick for each solution, repeat step 7 three times for eachof the remaining commercial food colouring.10. Repeat step 7 for the food/item samples, except spot each sample 10 times on thepaper. If the spots appear faint, repeat spotting again, adding to the spots until they areclearly visible. Again, allow the spots to dry between each application.11. Allow the prepared chromatography paper to dry before developing it using the mobilephase (Part B).5
a)b)Figure 6: a) Preparation of the food colouring samples b) Spotted samples on the chromatography paper:food/item samples on the left, standard food colourings on the right.Refer to Figure 7 regarding the identities of the dyes used in the commercial food colouring ofthe Club House brand. Use this information to help identify the compounds present in yourfood/item samples.Club House Regular LineColour DyesRedRed 40, Red 3Yellow Yellow 5, Red 40Green Yellow 5, Blue 1BlueBlue 1, Red 40Club House Neon LineColourDyesPinkRed 40PurpleRed 3BlueBlue 5YellowYellow 1Figure 7: List of FD&C compounds present in the "Club House" brand of food colouring.Part B - Preparation of the Mobile Phase1. Prepare a 0.1 % (m/v) NaCl solution for use as the mobile phase.2. To a large bowl, add ¼ teaspoon (1.5 g) of table salt and 1.5 L (6 cups) of water.3. Stir the 0.1 % NaCl solution.4. Choose a clear container that is tall enough to cover the height of the preparedchromatography paper (minimum of 11-12 cm in height).5. If the chosen container is less wide than the Whatman chromatography paper (ex. a talldrinking glass), slowly and carefully roll the paper into a cylinder and staple the edgestogether, only after the spots have dried.Note: the edges should be parallel to each other and not overlap or touch. Thereshould be a gap between the two edges.6
Figure 8: a) Stapled chromatogram, b) Stapled chromatogram in beaker6. Fill the bottom of the container with 1-1.5 cm of the 0.1% NaCl solution. Cover the top ofthe container with a plastic wrap to let the container saturate with the water vapour for 5minutes. Ensure the height of the 0.1% NaCl solution is not more than 1.5 cm, otherwisethere is risk of washing the spots off the paper into the mobile phase.Part C - Development of the Chromatogram(s)a)b)Figure 9: a) Chromatogram developing in large width containerb) Chromatogram developing in small width container.1. Remove the plastic wrap and place the chromatography paper in the container(developing chamber). The paper must not touch the sides of the container.2. Cover the container with the plastic wrap again.3. Remove the paper from the container when the solvent front (mobile phase) is 2 cm fromthe top of the paper. Lay it flat on a paper towel.4. With a pencil, trace the solvent front to mark how far it reached on the chromatogram. Allthe spots can be marked after the chromatogram has been allowed to sit for one minute.7
5. Using a hairdryer, or another heat source (do not burn the paper!), dry thechromatogram for approximately 5 minutes to stop the solvent front from continuing tomigrate.6. If the chromatogram is not dried immediately, the solvent front may continue to migrateas it dries, and you will have to re-draw the solvent front if it moves.7. Allow to the chromatogram to completely air dry before analyzing your results (possiblyovernight).8. More food/item samples can be analysed with the remaining unused chromatographypaper. Continue to use the commercial food dyes as the standards.Calculations and Data Analysisb)a)Figure 10: a) Developed chromatogram sample, b) Rf determination of sample chromatogram. Samples from left toright: Red Gatorade, Orange Gatorade, Blue Gatorade (too faint), Club House dyes: Red, Yellow, Green, Blue, and aBlack transparency marker (Wet-Erase)1. Measure and record the distance traveled by the solvent front from the origin line on thechromatogram(s).2. Measure and record the distances from the origin line traveled by all samples.3. Some spots will result in tailing, be sure to circle the top of the spot and mark the centerof that circle, not the tail (Figure 10).4. Calculate the Rf value for each spot and record them in Table 2 of the Data section.5. Identify the FD&C food dyes in the food/item samples, as well as in the commercial foodcolours, in Table 2 of the Data section.8
Name:SectionDatePaper ChromatographyDataComposition of the mobile phase:Distance of solvent front from origin (cm):You may need to divide some of the boxes into multiple rows if the dye separated into morethan one color per spot. Use less or add extra rows as necessary.SpotNumberSpot LabelSolvent Distance(cm)Spot Distance(cm)Rf Value12345678910Table 2: Calculated Rf values and Identification of spots on chromatogram(s)9FD&CDye #
Troubleshooting suggestions: You can use the commercial “Club House” dyes of the regular colours or the neon dyes.If you use a different brand, contact the company to ask them which FD&C compoundsare present in their food colourings. The less concentrated a sample is, the more applications will be needed for a samplewhen spotting on the chromatography paper. If toothpicks are not available, use an object with a small sharp tip to control the size ofthe spots (for example the prong of a fork, tip of a skewer, a paper clip or a comb) After the chromatography paper has been removed from the developing chamber, dry ituntil it is slightly damp using a hair dryer (do not use a flame), then allow to air dryovernight. If you do not dry the chromatogram, it is possible that the solvent may continueto migrate. If this happens, you must re-trace the solvent front as it has moved from itsoriginal spot. If you do not have a ¼ teaspoon measuring spoon, you may use a ½ teaspoon or fullteaspoon, but the volume of water used should be adjusted for the proper dilution. Checkwith your instructor to make sure your dilution calculations are correct.ReferencesBranch, Legislative Services. “Consolidated Federal Laws of Canada, Food and DrugRegulations.” Food and Drug Regulations, 19 June 2020, .C., c. 870/page-36.htmlDepartment of Chemistry. (2019, Fall). ‘Thin Layer Chromatography’, Organic Chemistry 202BZF-05 Laboratory Experiments. Montreal, QC: Dawson College.Cash, D. Ph.D. (Professor, Mohawk College of Applied Arts and Technology, Retired). ‘PaperChromatography of Food Colour Dyes’, Mohawk College Experiments by David omatography.pdfDepartment of Chemistry. (Revision F8). ‘Paper Chromatography of Food Dyes and Colors’,Clarksville, Tennessee: Austin Peay State fault/files/classfiles/paper chromotography of food dyes and colors mod419.pdfAcknowledgements Dawson College CLAW (Chemistry Lab Alternative Workforce)Department of Chemistry, Dawson CollegeElie Saadé, TAV College; for access to laboratory equipment and chemicals, as well asuseful suggestions and helpful insight into experimental procedures.Last updated June 22, 202010
Sharpie Tie-dye Chromatography (optional)Create your own art using the concept ofchromatography with Sharpies and isopropanol.Instructions from Martha Stewart.comReferences:“Sharpie Tie-Dye T-Shirt.” Martha Stewart, Martha Stewart, 20 Sept. t-shirt.https://www.youtube.com/watch?v DjWrUyRTVR011
Paper Chromatography of Food Dyes and Ink Objectives To identify the food drug and cosmetic (FD&C) dyes found in food/beverage samples (such as Kool-aid, Gatorade, popsicles), or water-soluble markers, using the paper chromatography technique. Determination of the retention
2.3.1 Liquid chromatography (LC) 20 Size-exclusion chromatography (SEC) 20 Ion-exchange chromatography (IEC) 22 Reversed-phase chromatography (RP) 23 Reversed-phase ion pairing chromatography (RPIP) 24 2.3.2 Gas chromatography (GC) 25 2.3.3 Electrophoretic techniques 25 2.3.4 Isotope dilution analysis (IDA) 26 3 EXPERIMENTAL RESEARCH 27 Aims 27
Chromatography 481 27.4.2 Partition (Liquid–Liquid) Chromatography 482 27.4.2.1 Introduction 482 27.4.2.2 Coated Supports 483 27.4.2.3 Bonded Supports 483 27.4.3 Ion-Exchange Chromatography 483 27.4.4 Size-Exclusion Chromatography 485 27.4.5 Affinity Chromatography 488 27.5 Analys
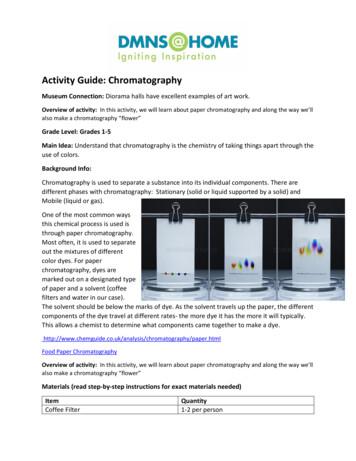
Activity Guide: Chromatography Museum Connection: Diorama halls have excellent examples of art work. Overview of activity: In this activity, we will learn about paper chromatography and along the way we'll also make a chromatography "flower" Grade Level: Grades 1-5 Main Idea: Understand that chromatography is the chemistry of taking things apart through the
Paper chromatography is an example of a more general type of chromatography called adsorption chromatography. The paper acts as an adsorbent, a solid which is capable of attracting and binding the components in a mixture (see Figure 1). The mixture to be separated is "spotted" onto the surface of the paper and a solvent is allowed to seep .
“Laboratory Chromatography Guide” – A close look at preparative liquid chromatography The present “Laboratory Chromatography Guide” is dedicated to preparative liquid chromatography, a common purification techni-que in most chemical or life science laboratories. T
1. A LC technique which separates solutes based on their adsorption to an un-derivatized solid particles is known as adsorption chromatography, or liquid-solid chromatography. 2. Adsorption chromatography was the first type of column liquid chromatography developed (Tsweet, 1903). However, it is currently
Affinity chromatography, (g) Gas chromatography, (h) Supercritical fluid chromatography, (i) High Performance Liquid Chromatography, (j) Capillary electrophoresis, 4. Classification of chromatographic methods - according to separation methods, according to development procedures. (i)Thin Layer Chromatography: Theory and principles, outline of the
There are many forms of chromatography, but two are very common and well known to all analytical scientists and serve to illustrate the diversity of analytical techniques. These are gas chromatography (GC) and liquid chromatography (LC). GPC/SEC is a form of LC. These techniques are described in brief below. Gas chromatography


